No Products in the Cart


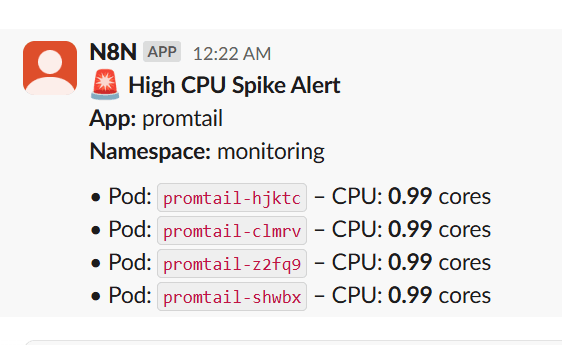
This workflow monitors Kubernetes pod CPU usage using Prometheus, and sends real-time Slack alerts when CPU consumption crosses a threshold (eg, 0.8 cores). It groups pods by application name to reduce noise and improve clarity, making it ideal for observability across multi-pod deployments like Argo CD, Loki, Promtail, applications etc.
Designed for DevOps and SRE teams and platform teams, this workflow is 100% no-code, plug-and-play, and can be easily extended to support memory, disk, or network spikes. It eliminates the need for Alertmanager by routing critical alerts directly into Slack using native n8n nodes.
This n8n workflow polls Prometheus every 5 minutes ⏱️, checks if any pod's CPU usage crosses a defined threshold (eg, 0.8 cores) 🚨, groups them by app 🧩, and sends structured alerts to a Slack channel 💬.
🔗 Set your Prometheus URL with required metrics (container_cpu_usage_seconds_total, kube_pod_container_resource_limits)
🔐 Add your Slack bot token with chat:write scope
🧩 Import the workflow, customize:
Threshold (e.g., 0.8 cores)
Slack channel
Cron schedule
🧠 Adjust threshold values or query interval
📈 Add memory/disk/network usage metrics
💡 This is a plug-and-play Kubernetes alerting template for real-time observability.
Prometheus, Slack, Kubernetes, Alert, n8n, DevOps, Observability, CPU Spike, Monitoring