No Products in the Cart
This workflow demonstrates how to dynamically generate a line chart using the QuickChart node based on data provided in a JSON object and then upload the resulting chart image to Google Drive.
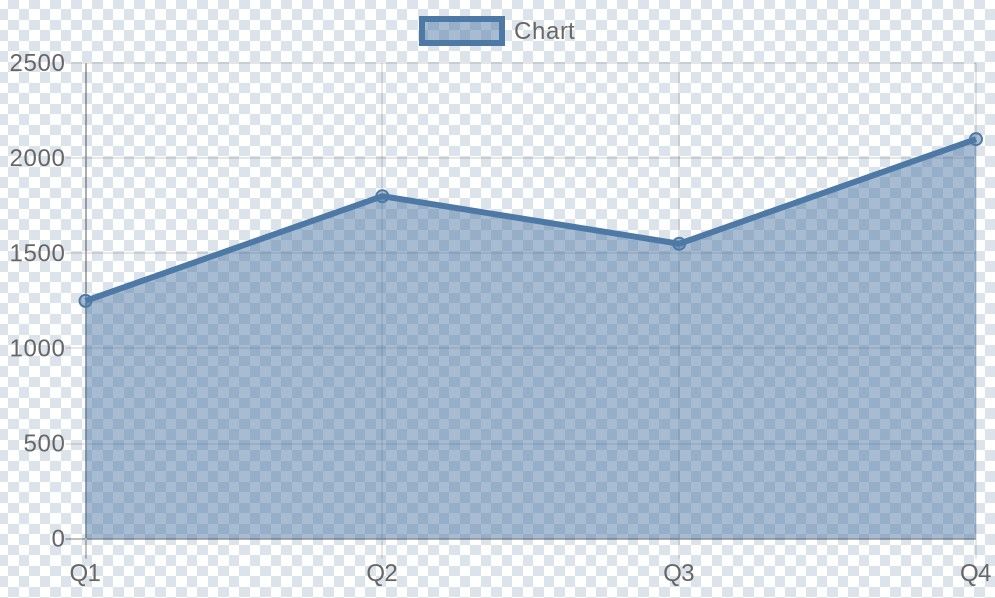
Edit Fields: Set JSON data to test ) defines a sample JSON object named jsonData . This object contains:
reportTitle : A title (not used in the chart generation in this example, but useful for context).labels : An array of strings representing the labels for the chart's X-axis (eg, ["Q1", "Q2", "Q3", "Q4"]).salesData : An array of numbers representing the data points for the chart's Y-axis (eg, [1250, 1800, 1550, 2100]).line chart.jsonData.labels array ( Labels Mode: From Array ).jsonData.salesData array as the input data (Note: This configuration places data in the top-level 'Data' field. For more complex charts with multiple datasets or specific dataset options, configure datasets under 'Dataset Options' instead).data .Google Drive: Upload File ):
data ) from the QuickChart node.chart.png ).Google Drive: Upload File node.Google Drive: Upload File node, you can change the Drive ID and Folder ID to specify exactly where the chart should be uploaded.labels and salesData arrays within the Edit Fields: Set JSON data to test node to use your own data. Ensure the number of labels matches the number of data points.Edit Fields: Set JSON data to test node with nodes that fetch data from real sources like:
labels and salesData arrays). You might need another Set node to structure the data correctly before the QuickChart node.Chart Type parameter (eg, change from line to bar , pie , doughnut , etc.).Chart Options parameter within the QuickChart node to add titles, change colors, modify axes, etc., using QuickChart's standard JSON configuration options.Data field.Dataset Options -> Add option -> Add dataset .Data field within the dataset using an expression like {{ $json.jsonData.salesData }} .Google Drive: Upload File node with other nodes to handle the chart image differently:
Write Binary File : Save the chart to the local filesystem where n8n is running.Slack / Discord / Telegram : Send the chart to messaging platforms.Move Binary Data : Convert the image to Base64 to embed in HTML or return via webhook response.Tags: (Suggestions for tags field)
QuickChart , Chart , Visualization , Line Chart , Google Drive , Reporting , Automation