📊 Visualize all your AI Token Usage analytics Dashboard using a single n8n Workflow

Artwork Generated with ✨ ideoGener8r n8n workflow template
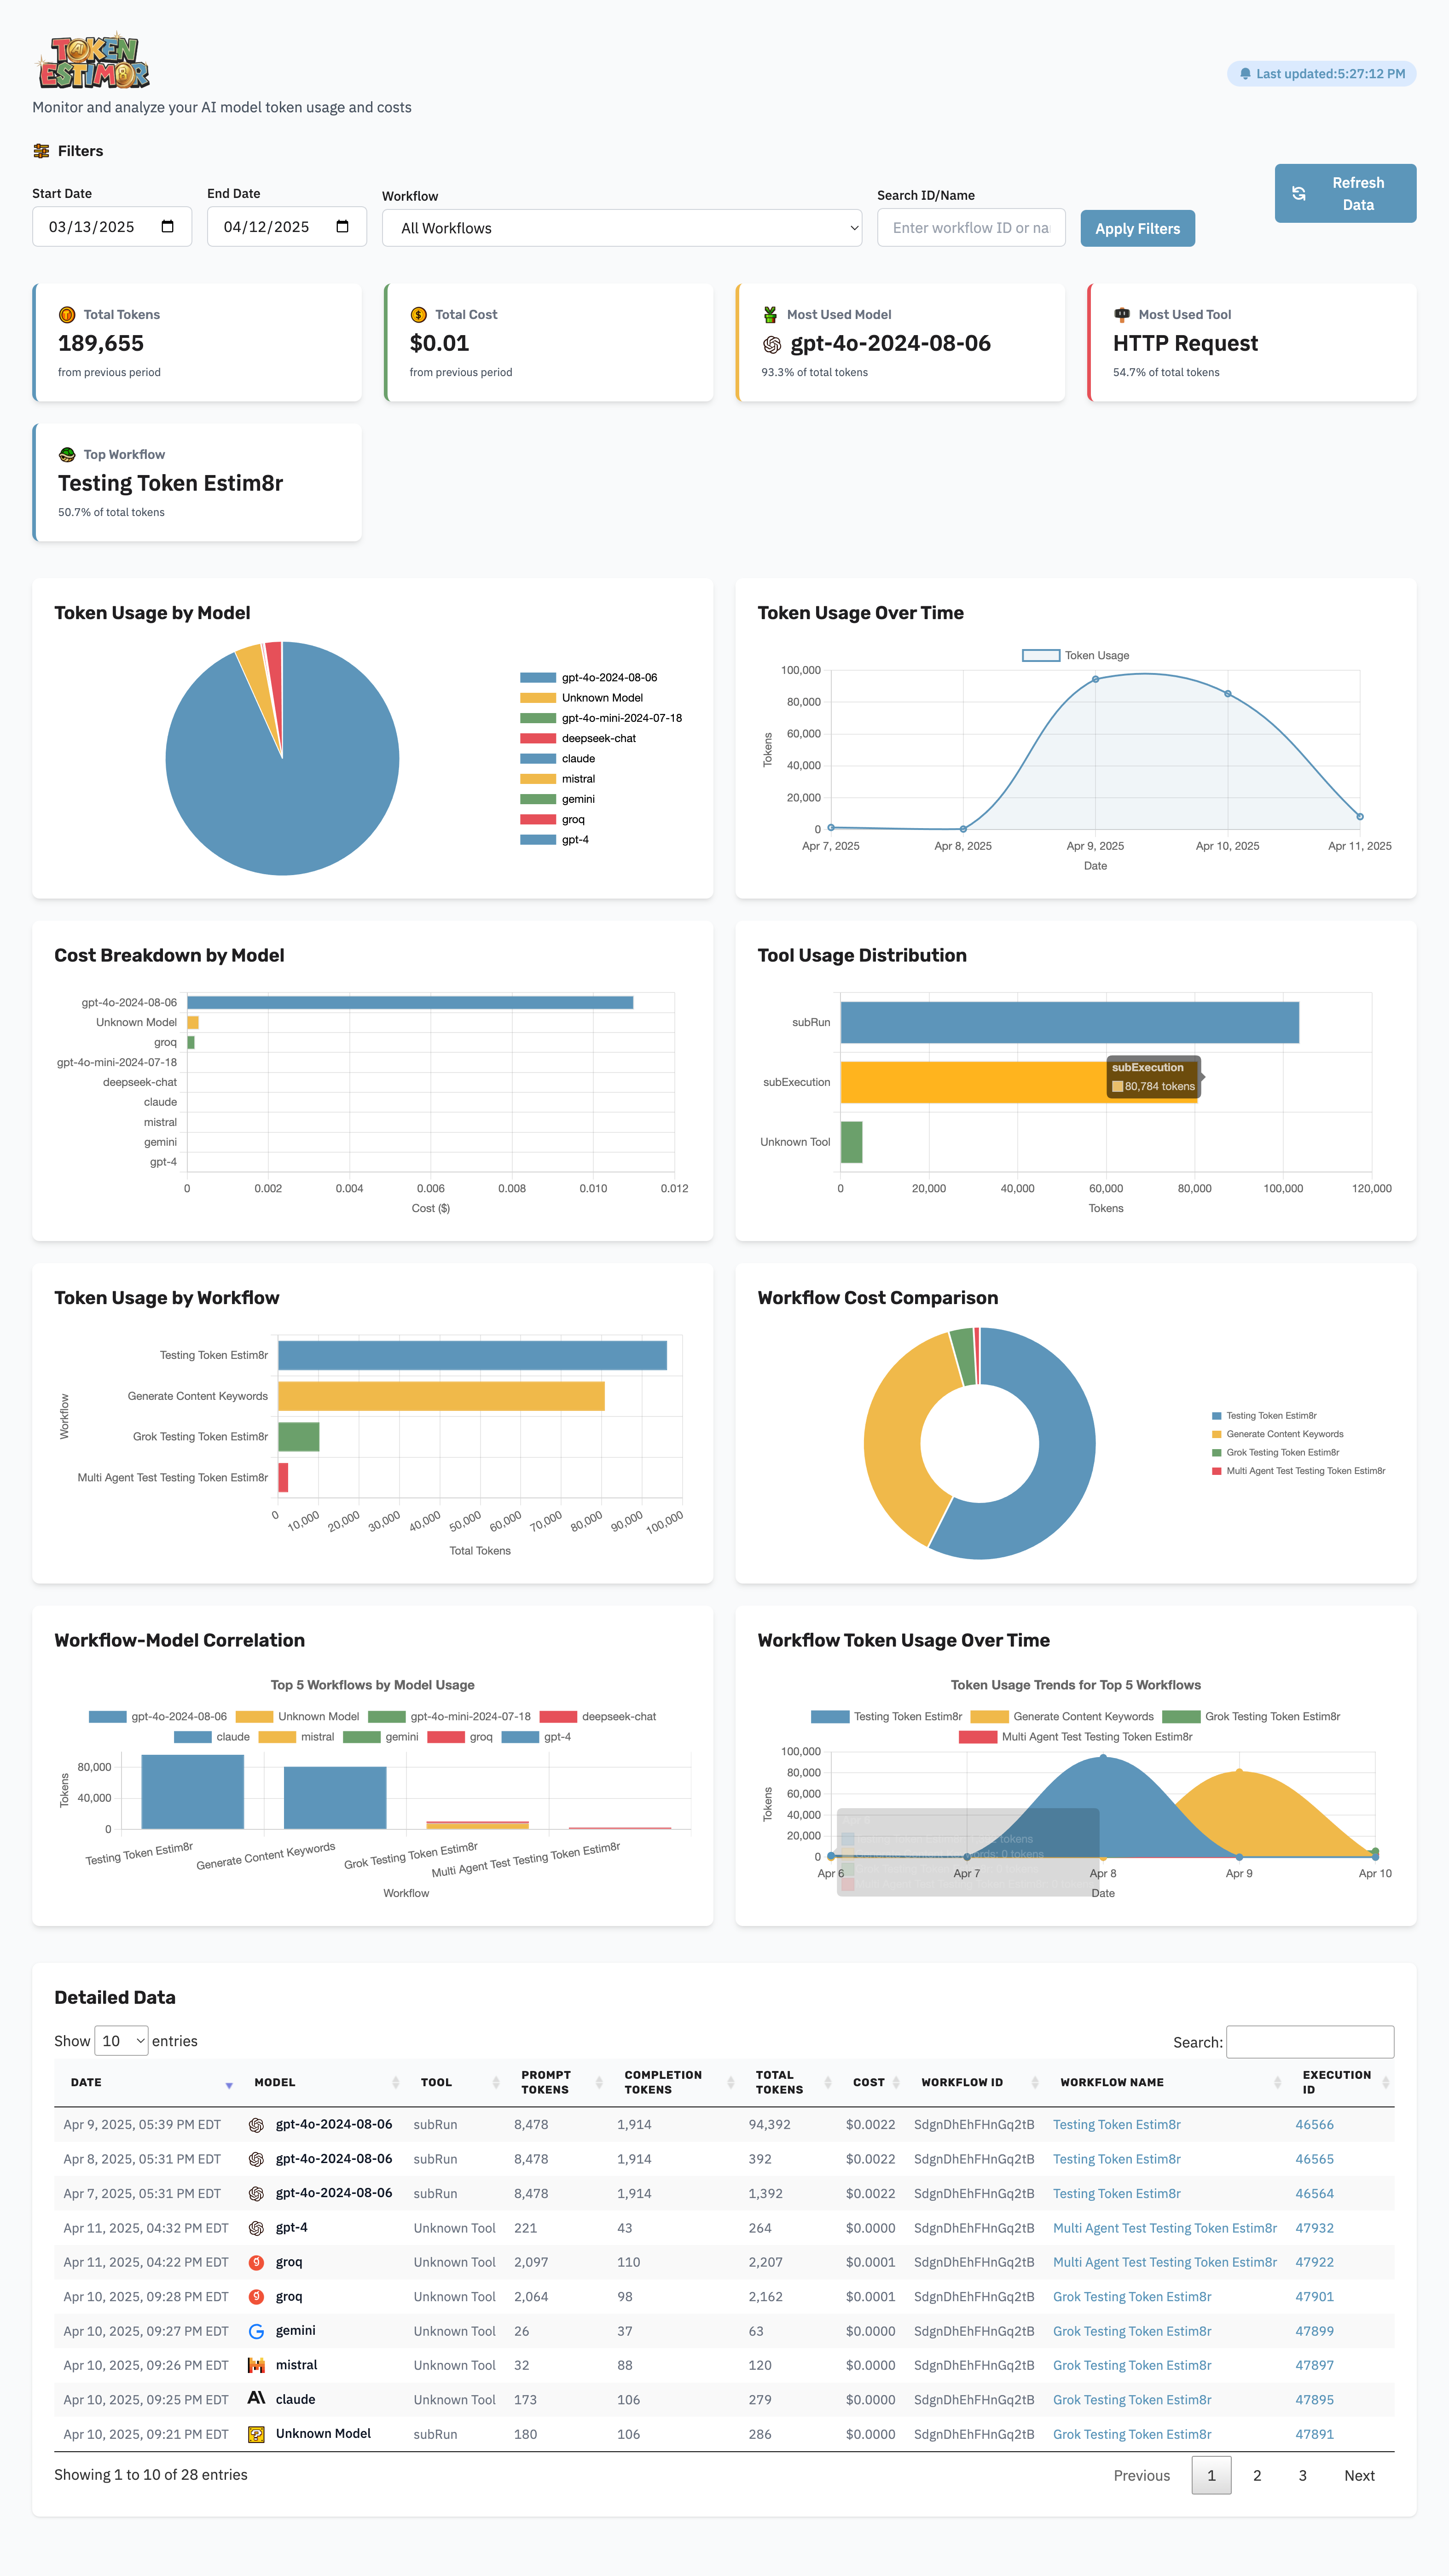
Token Estim8r UI is the premium version of our token tracking solution for n8n users who want real-time insight into AI model usage and exact cost per execution — all in a beautifully designed analytics dashboard.
We've done the work with over 4000 lines of code for you to simply add a pre-configured HTTP Request node to the end of any workflow you want to track, and Token Estim8r UI will handle the rest: collecting data, analyzing token usage, calculating model costs, and feeding everything into a clean UI with charts, graphs, and summaries.
🖼️ What the Dashboard Looks Like
🙋♂️ Who is this for?
This workflow is perfect for:
- AI engineers
- Automation specialists
- Business analysts
- Teams using OpenAI, Anthropic, Claude, or any token-based LLM
If you’re managing API budgets or optimizing prompt performance, this tool provides immediate visibility into where tokens (and money) are going.
😌 What problem does this solve?
n8n makes it easy to build powerful workflows — but it doesn’t natively track OpenAI token usage or cost. Without that visibility, it’s impossible to:
- Know what each automation is costing
- Spot inefficiencies in prompt construction
- Track cost trends over time
Token Estim8r UI solves that with zero manual logging.
⚙️ What this workflow does
- Fetches detailed execution logs from n8n
- Extracts prompt/completion token usage per model/tool
- Optionally retrieves live pricing or use preset pricing as of 4/2025
- Calculates total cost per run
- Sends data to a backend for aggregation
- Displays a full-featured analytics dashboard with:
- Total tokens, cost, and usage trends
- Most used models/tools
- Workflow-model correlations
- Cost breakdowns and comparisons
- Workflow usage over time
-
Auto-complete workflow search with filtering by ID or name
-
Filter by date or workflow (single or all workflows)
- Built in image server
-
Sortable & searchable data table of filtered results with:
- Prompt & completion token breakdown
- Cost calculations
- Workflow name + direct link to the workflow
- Link to exact execution in n8n
🛠️ How Setup Works
- Import the Token Estim8r UI workflow into your n8n instance
- Deploy the included dashboard (React/Next.js app, hosted or self-hosted)
- Configure Google Sheets or your preferred backend (e.g., Supabase, Airtable)
- Copy the prebuilt HTTP Request node into the end of any n8n workflow
- Run your workflow — data is captured, aggregated and stored automatically in Google Sheets 🎉
🔄 What Makes This Better than the simple version?
The simple version logs to Google Sheets only. This premium UI version adds:
- Full analytics dashboard
- Cost aggregation across all workflows
- Graphs, filters, and model/tool comparisons
🔧 Customization Ideas
- Switch backend to Supabase or Firebase
- Add alerts via Slack when costs exceed thresholds
- Build weekly token cost summaries
- Track model performance across teams
- Add filters by user/session/timeframe
🧠 Why Users Love It
"Token Estim8r UI is exactly what I needed to take control of my AI costs inside n8n. It’s plug and play — and the dashboard makes optimization easy."
– Beta user, AI Ops Lead
😐 If you're serious about building with AI in n8n,
Token Estim8r UI gives you the visibility to scale confidently. 🚀